Introduction
Overview
When an issue occurs during internal testing or customer deployment of Android IP phones, technical staff may need to provide debug information for troubleshooting and analysis. This guide explains how to collect the required diagnostic files.
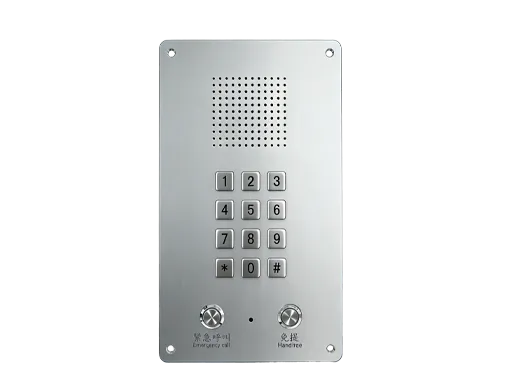
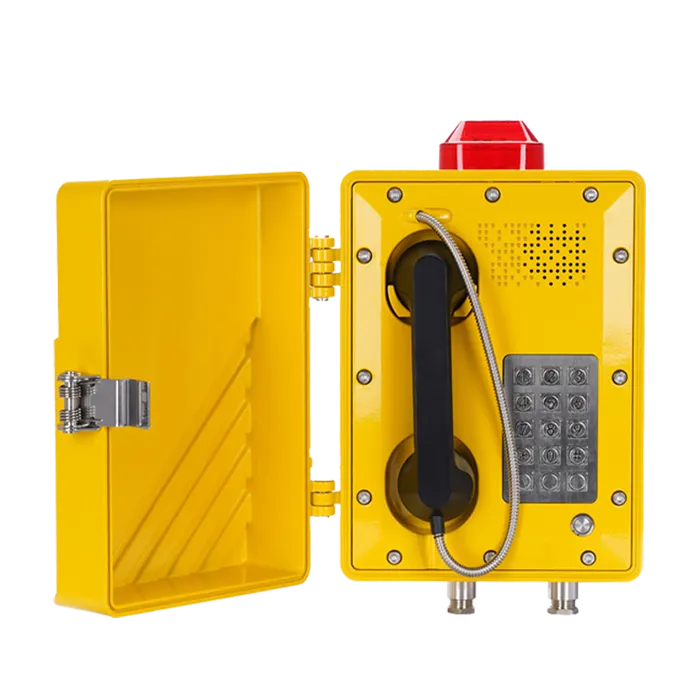
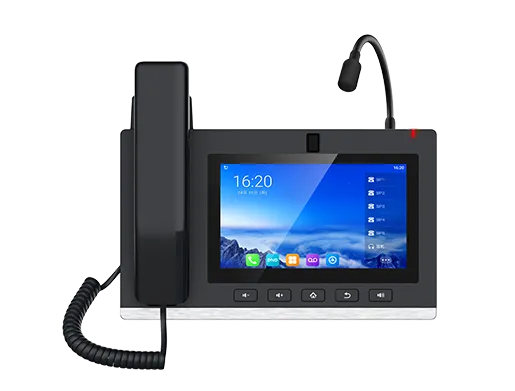
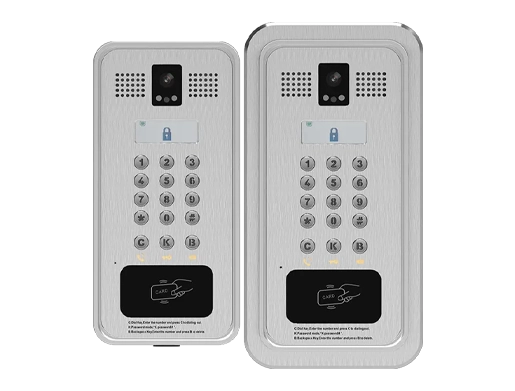
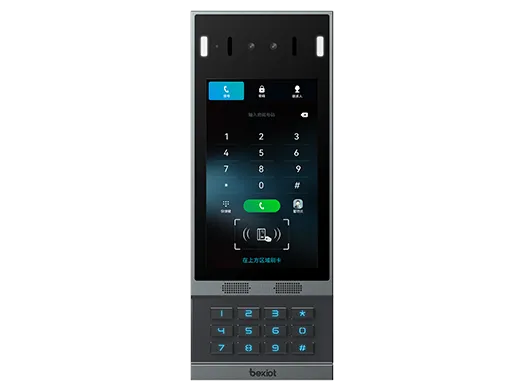
Supported Models
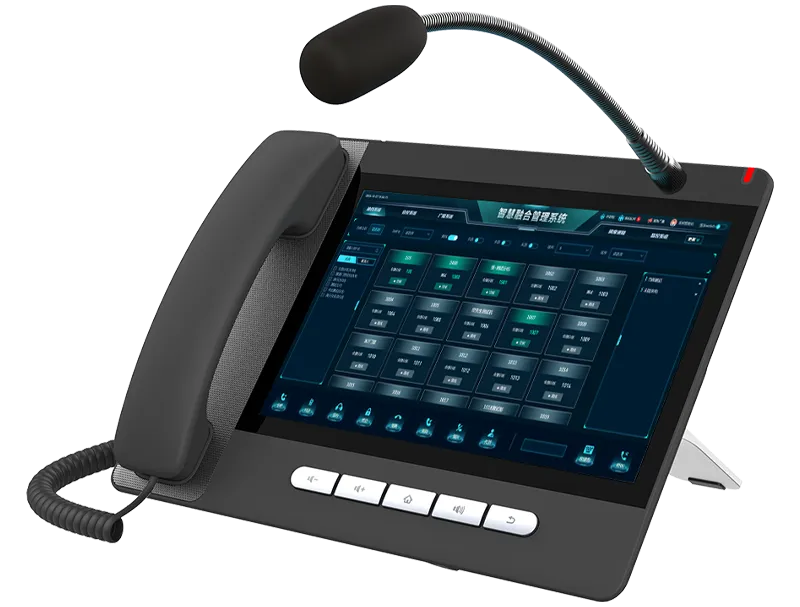
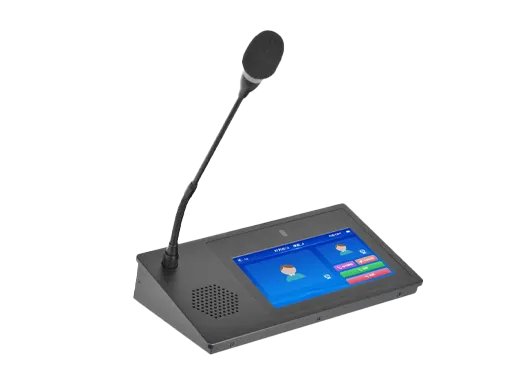
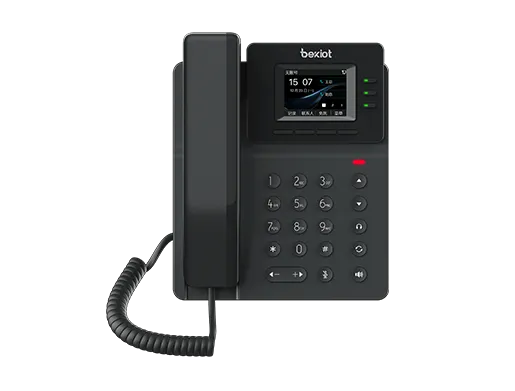
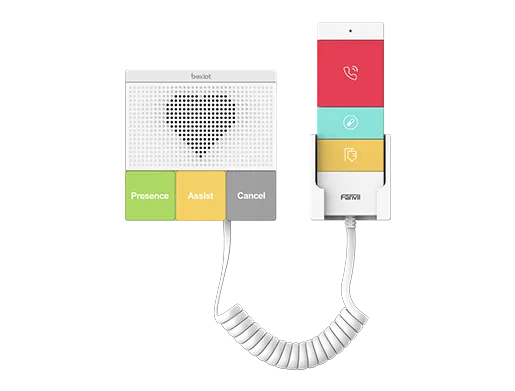
GP32i, BX7A, BF600S, BJ7A, Bi56A
Prerequisites
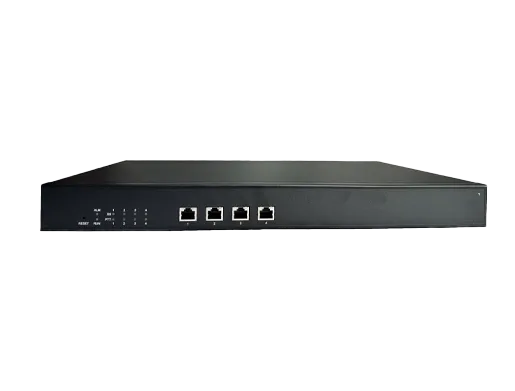
1. Prepare one Android IP phone, one USB flash drive, and one PoE switch or DC power supply. Connect the phone to the switch.
2. Prepare one PC for debugging, and connect it to the same switch. Make sure the PC and the phone can communicate with each other over the network.
Device and PC Connection Diagram
Connect the Android IP phone (A32i is used as the example here) to the switch, and connect the PC to the same switch. Make sure the network between the PC and the device is reachable. The connection example is shown in Figure 1.

Figure 1. Device and PC connection diagram
Troubleshooting Methods
Depending on the issue, different types of diagnostic information may be required for analysis. The following sections explain which files should be provided under different circumstances.
General Cases
In most cases, three files should be collected and provided to the R&D team:
1. Debug Syslog file
Log in to the phone web interface and go to System > Support Page, then find System Log.
Configure the following settings:
1) Enable Syslog
2) Set the Server Address to the IP address of the local PC
3) Set the Server Port to 514
4) Set the System Log Level to Debug
5) Enable Export Log
6) After the issue is reproduced, click Export Log to download the Syslog file
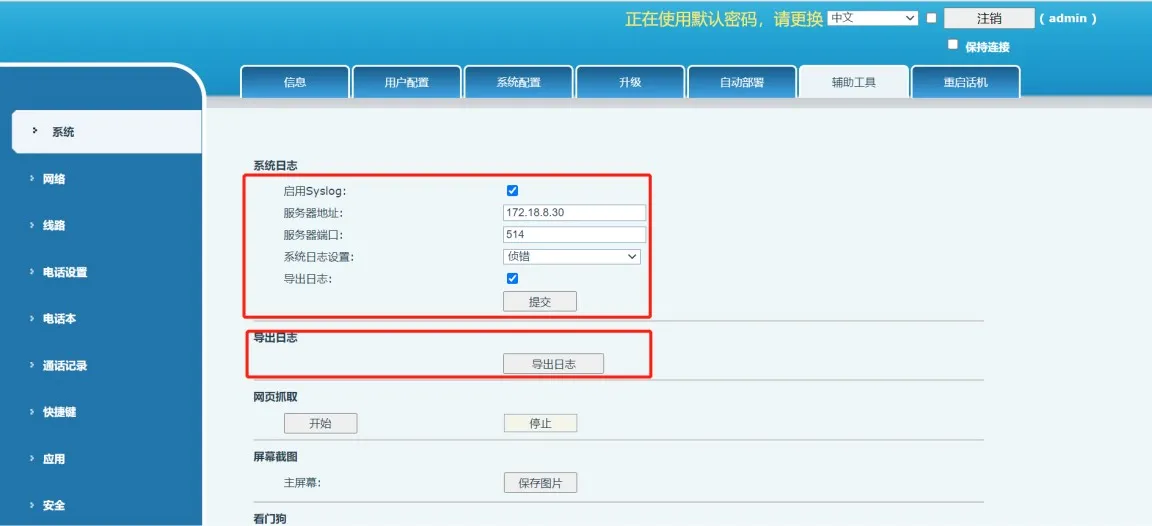
Figure 2. Exporting the debug syslog
2. Debug package
The debug package contains cached logs, runtime information, firmware details, and other internal diagnostic data from the phone. It can be exported from the web interface.
Go to System > Support Tool, find the One-click Export Debug Information option, and click Export. This process may take about one minute to complete.
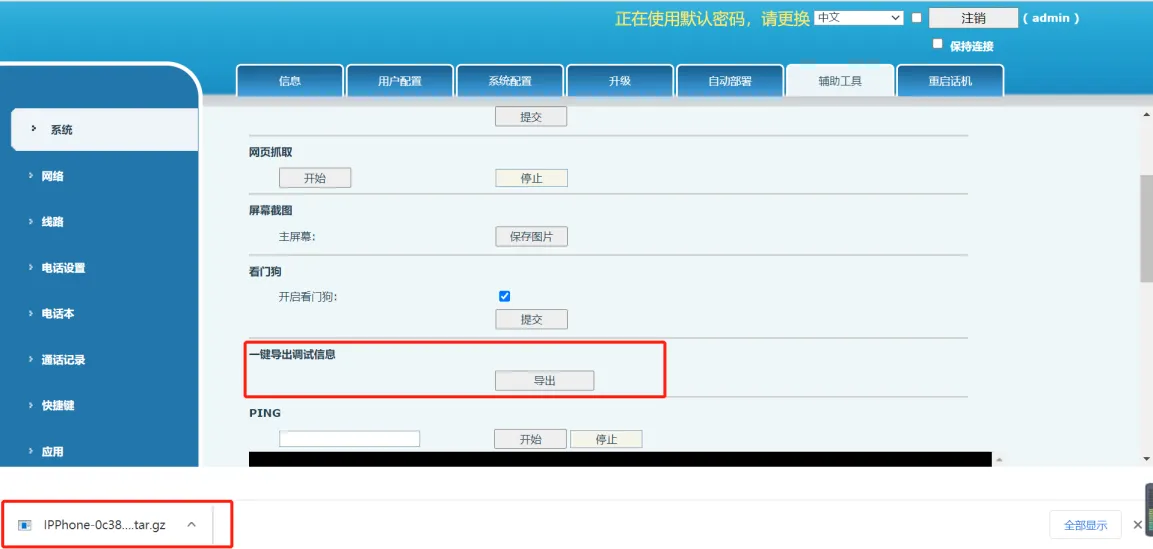
Figure 3. Exporting the debug package
3. Network packet capture file
A packet capture file records transmitted and received network packets and can be used for analysis in tools such as Wireshark.
To capture network traffic:
1) Click Start and wait for the web page to begin the capture process
2) Reproduce the issue
3) After the issue has been reproduced, click Stop
4) Open the browser download page to locate the captured packet file
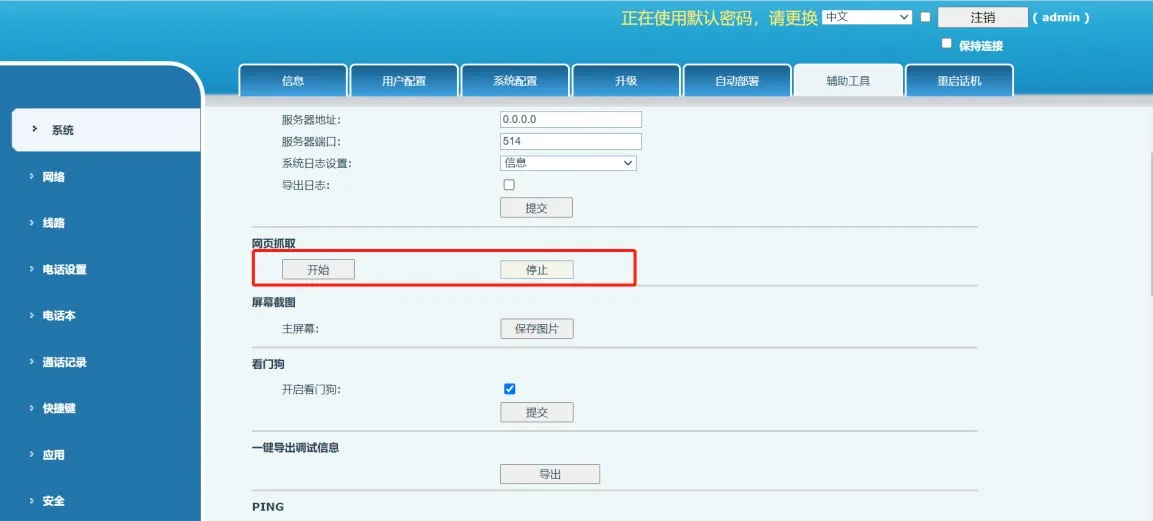
Figure 4. Capturing network packets
Special Cases
After providing the three files described above, additional information may still be required in some situations.
When Requested by R&D
After reviewing the Debug Syslog, debug package, and packet capture, the R&D team may ask for Android real-time logs to support deeper analysis. The following section explains how to collect Android real-time logs by using ADB.
Android real-time log
The Android platform continuously outputs runtime logs while the phone is operating. These logs can help engineers identify and analyze problems.
1. Install the ADB tool on the PC
You can download the appropriate ADB tool for your operating system from:
https://developer.android.google.cn/studio/releases/platform-tools
After installation, add the ADB installation path to the system environment variables. In Windows, go to This PC > Properties > Advanced system settings > Advanced > Environment Variables, then add the absolute ADB directory path to the Path variable.
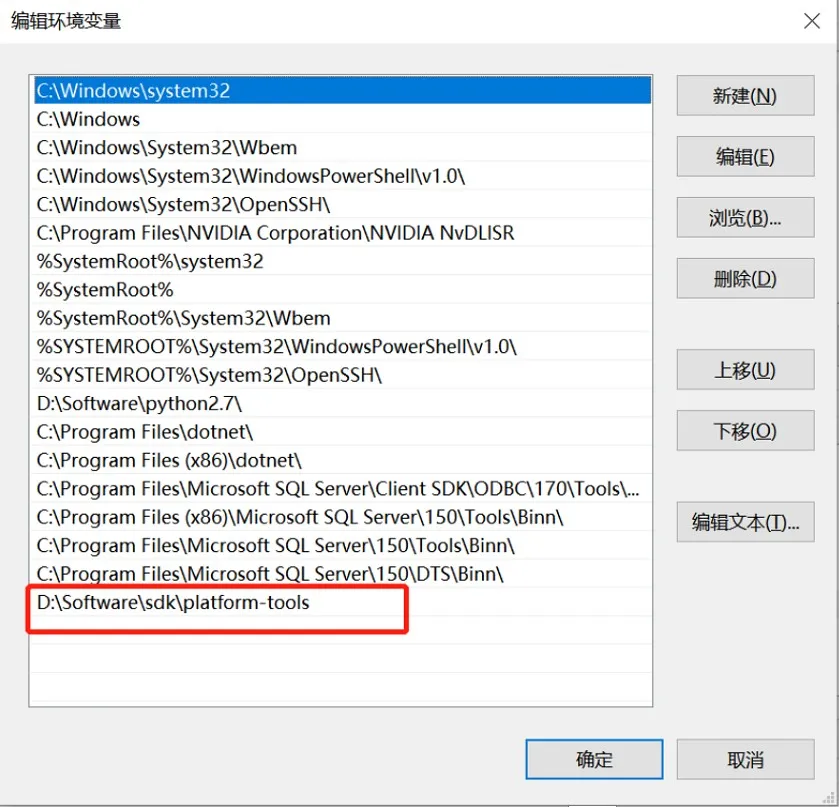
Figure 5. Adding the ADB path
Open a command prompt on the PC and enter the adb command. If the command runs successfully, ADB has been installed correctly.
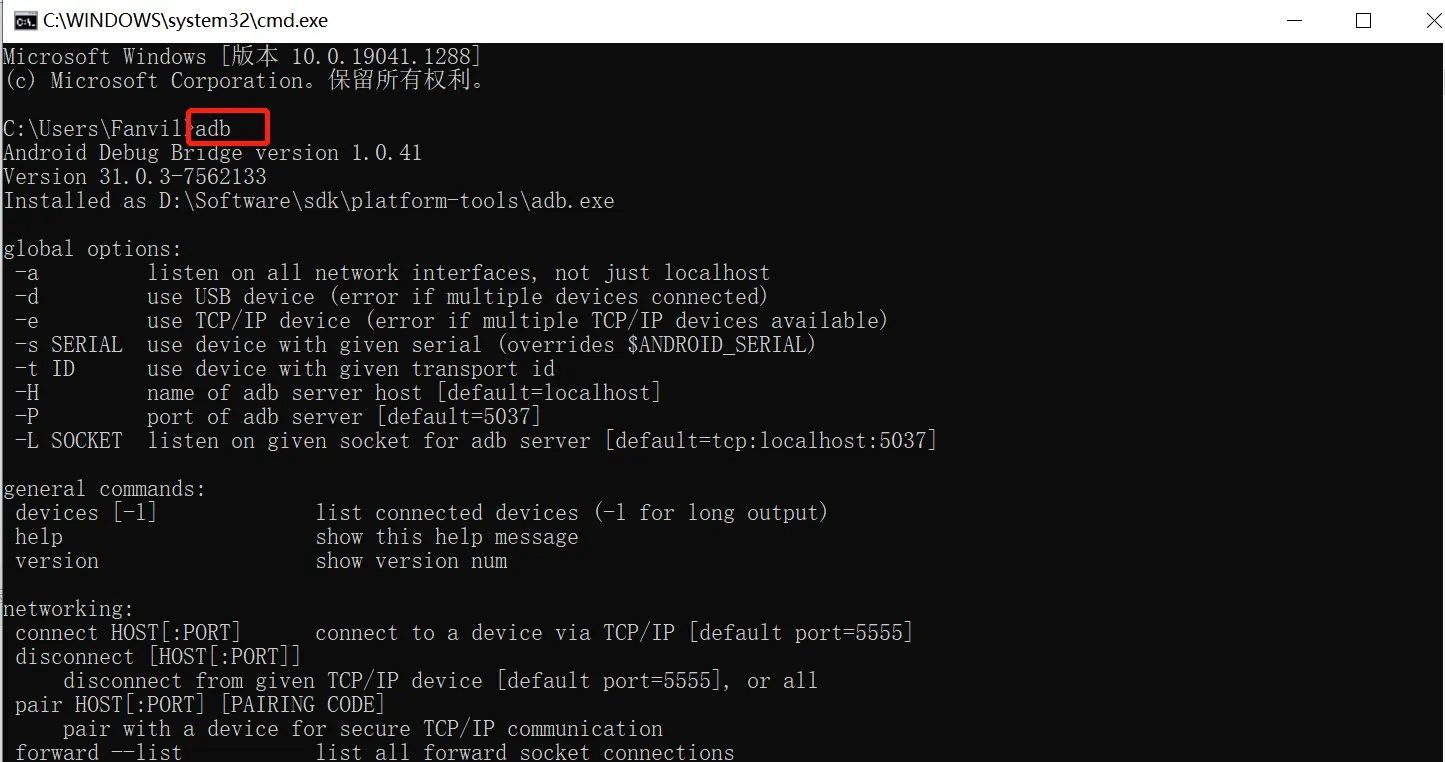
Figure 6. Successful ADB installation
2. Enable USB debugging on the phone
For Android firmware released after December 1, 2020, ADB debugging is disabled by default and must be enabled manually.
Insert a USB flash drive into the phone, then go to Settings > About Device and tap the firmware version number five times to enable Developer Mode.
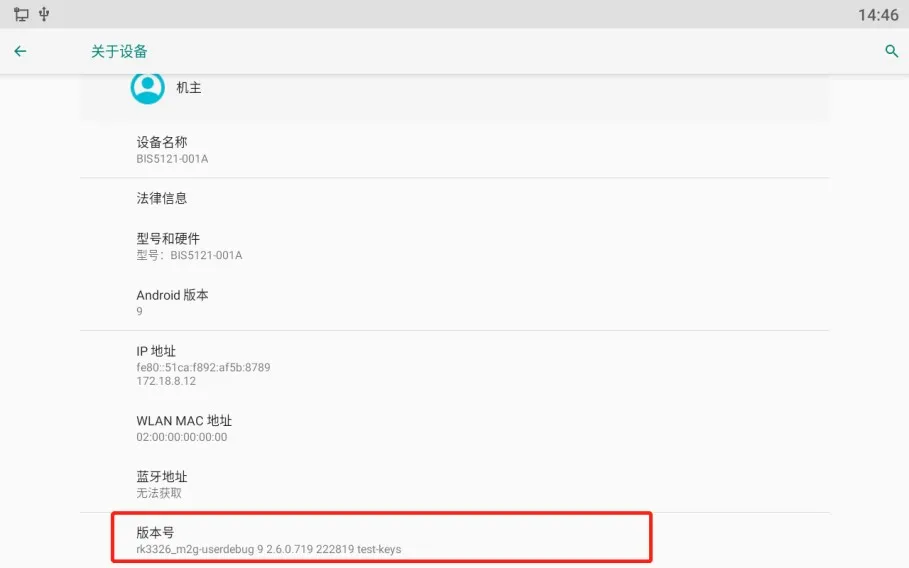
Figure 7. Enabling developer mode
Then go to Settings > System > Developer Options and turn on USB Debugging.
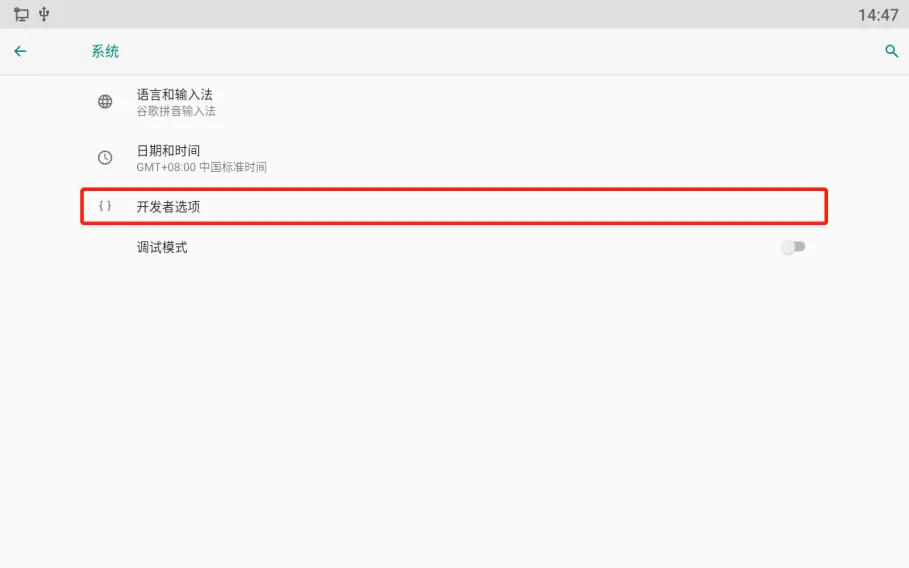
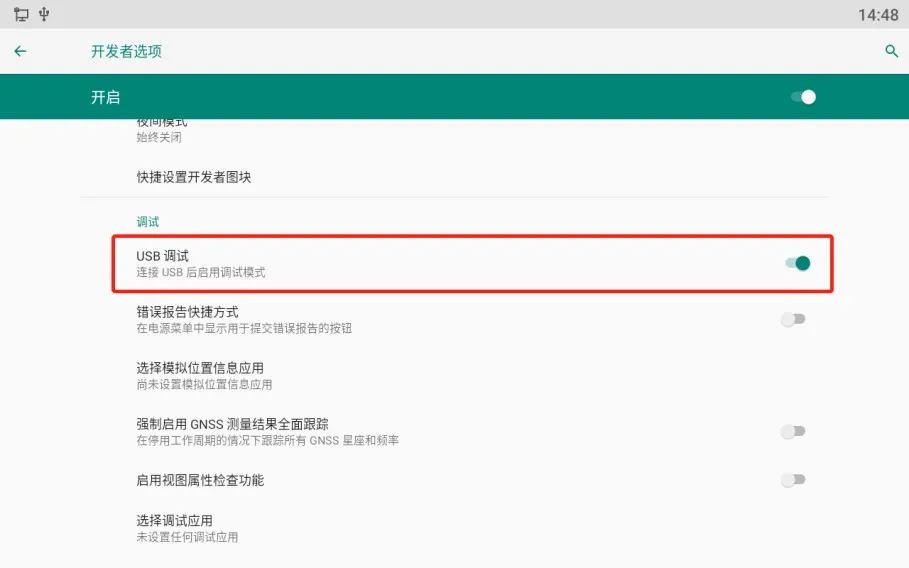
Figure 8. Enabling USB debugging
3. Change the debug log level
The default phone log level is typically set to Notice, which records only essential information. To capture more detailed logs, change the log level to Trace.
Go to Phone Settings > System Maintenance > Tools, and set the log level to Trace.
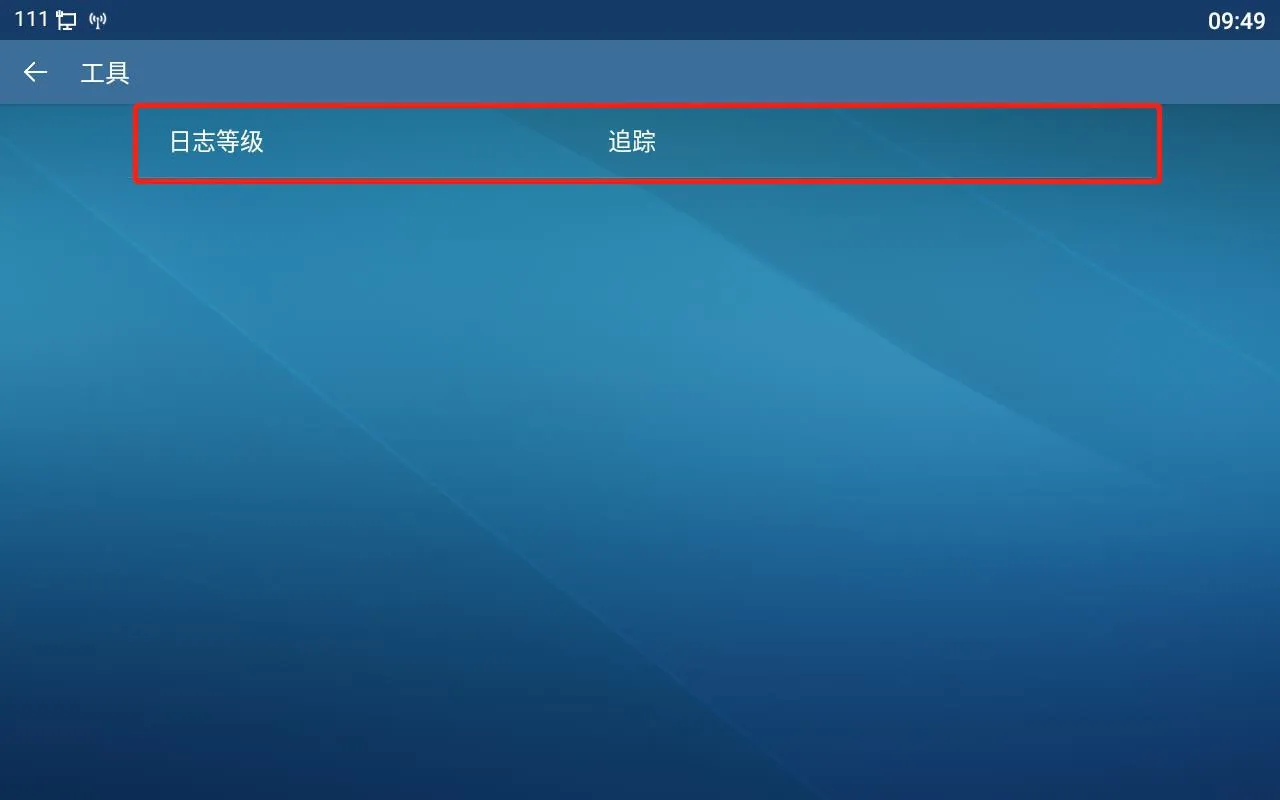
Figure 9. Changing the log level
4. Capture real-time logs
Use the following ADB commands:
adb connect 172.18.8.28
Replace 172.18.8.28 with the actual IP address of the phone. This command connects to the phone over the network.
adb devices
This command lists connected devices and lets you verify whether the phone is successfully connected.
adb logcat -G 16M
This command increases the log buffer size so more log content can be stored.
adb logcat > logcat-202111051708.log
This command saves the real-time log output to a file on the PC. A recommended naming format is: year + month + day + hour + minute + second + .log
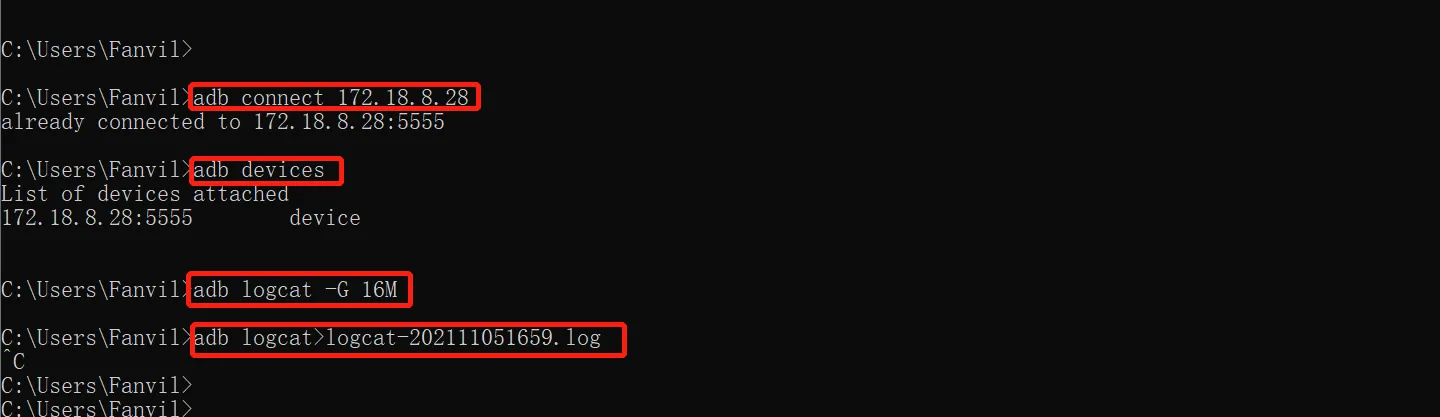
Figure 10. Capturing real-time logs
After logging is complete, run:
adb disconnect 172.18.8.28
This disconnects the PC from the phone. You can then find the generated real-time log file in the corresponding directory on your PC.
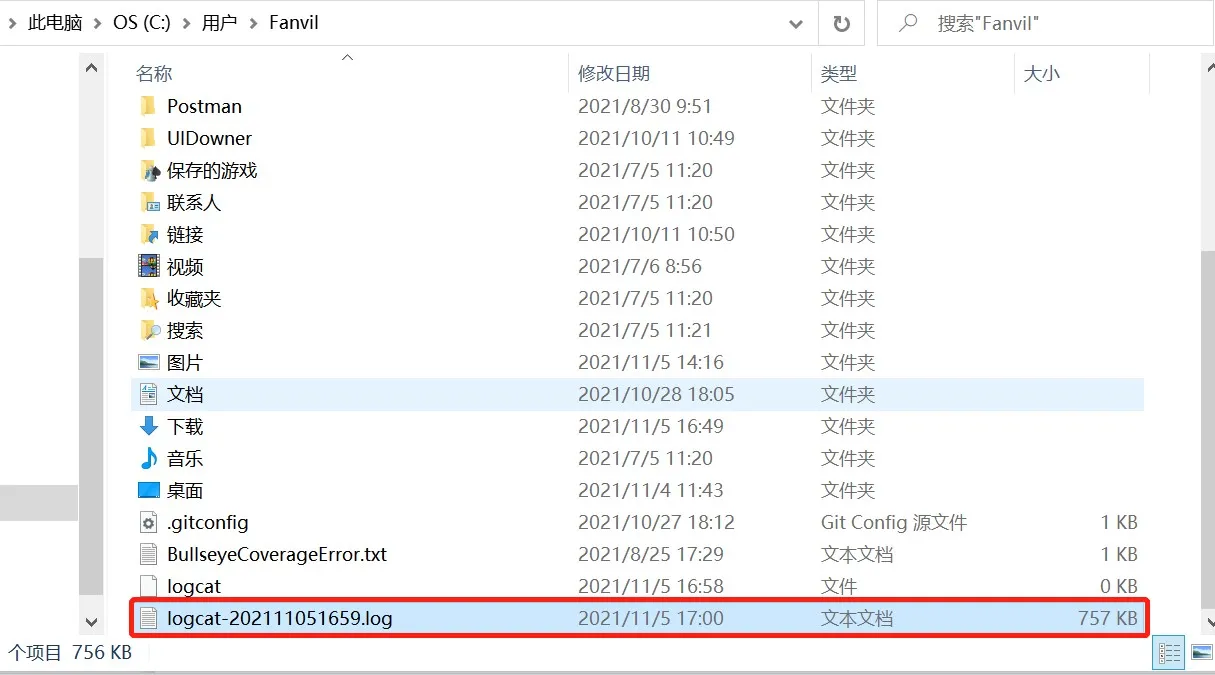
Figure 11. Real-time log file path
Screen-related Issues
If the issue is related to the LCD screen or display behavior, a screenshot file should also be provided.
Log in to the phone web interface and go to System > Support Page, then find Screen Screenshot. Click Save Image to download and save the screenshot.
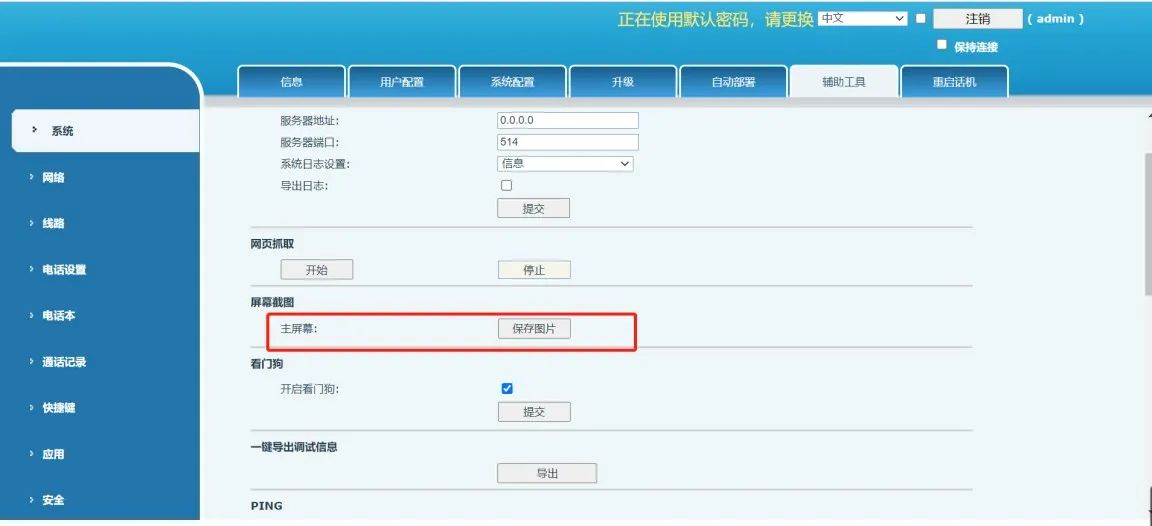
Figure 12. Saving a screen screenshot